
Low amplification plots may be caused by;
- Low quality PCR strip tubes, optical tubes, plates or sealing may be used
- Master mix may be melted many times (more than 3 times), efficiency may be down
- Kits may be out of date, please check the expiration dates of the RNA isolation solutions & diagnostic kits
- There is a low amplification plots above, if there is no amplification (if there is only a single straight line on the screen) then you can perform the instrument ‘self test’ function.
Optimal Software ‘X’ (Cycle axis) and ‘Y’ (Fluorescent axis) scale adjustment may be a solution to see the amplification plots higher;
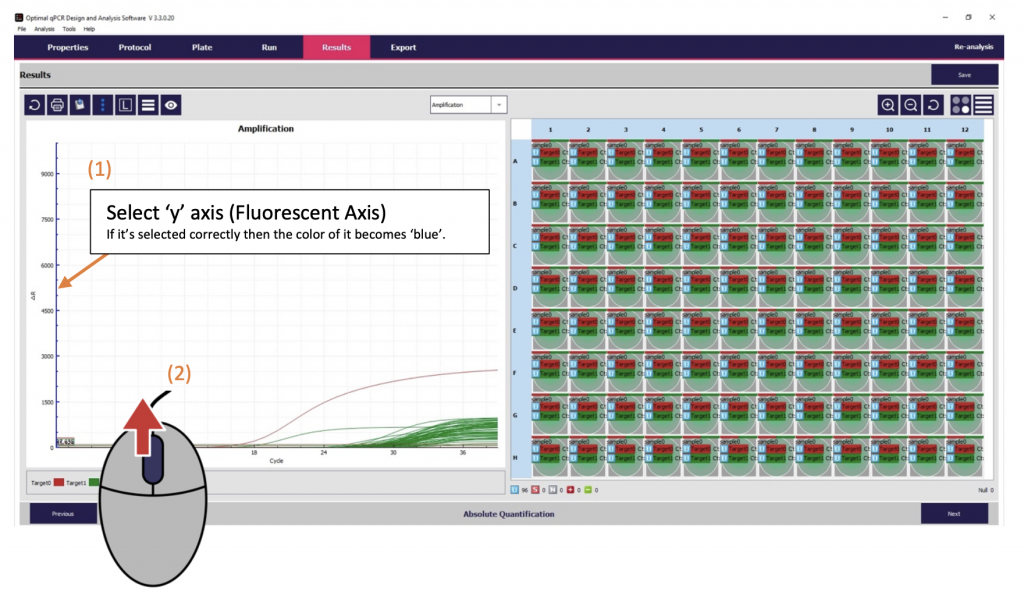
- Select ‘y‘ axis (Fluorescent value axis, when you select it correctly then the color changes to ‘blue‘
- Then use your mouse wheel to increase/decrease the scale of the ‘y’ axis.
- Amplification curves become more clear to interpret the results.

This will help you to check whether there is a sigmoidal application curve, or not. As above example, it’s clear that all internal controls are amplified as expected and there is no need to repeat any sample for this run.
Related links;
Pingback:What could be the reason of poor RT-PCR results? – LongGene Europe Ltd